Working with the Budget Scenario Optimization Tool
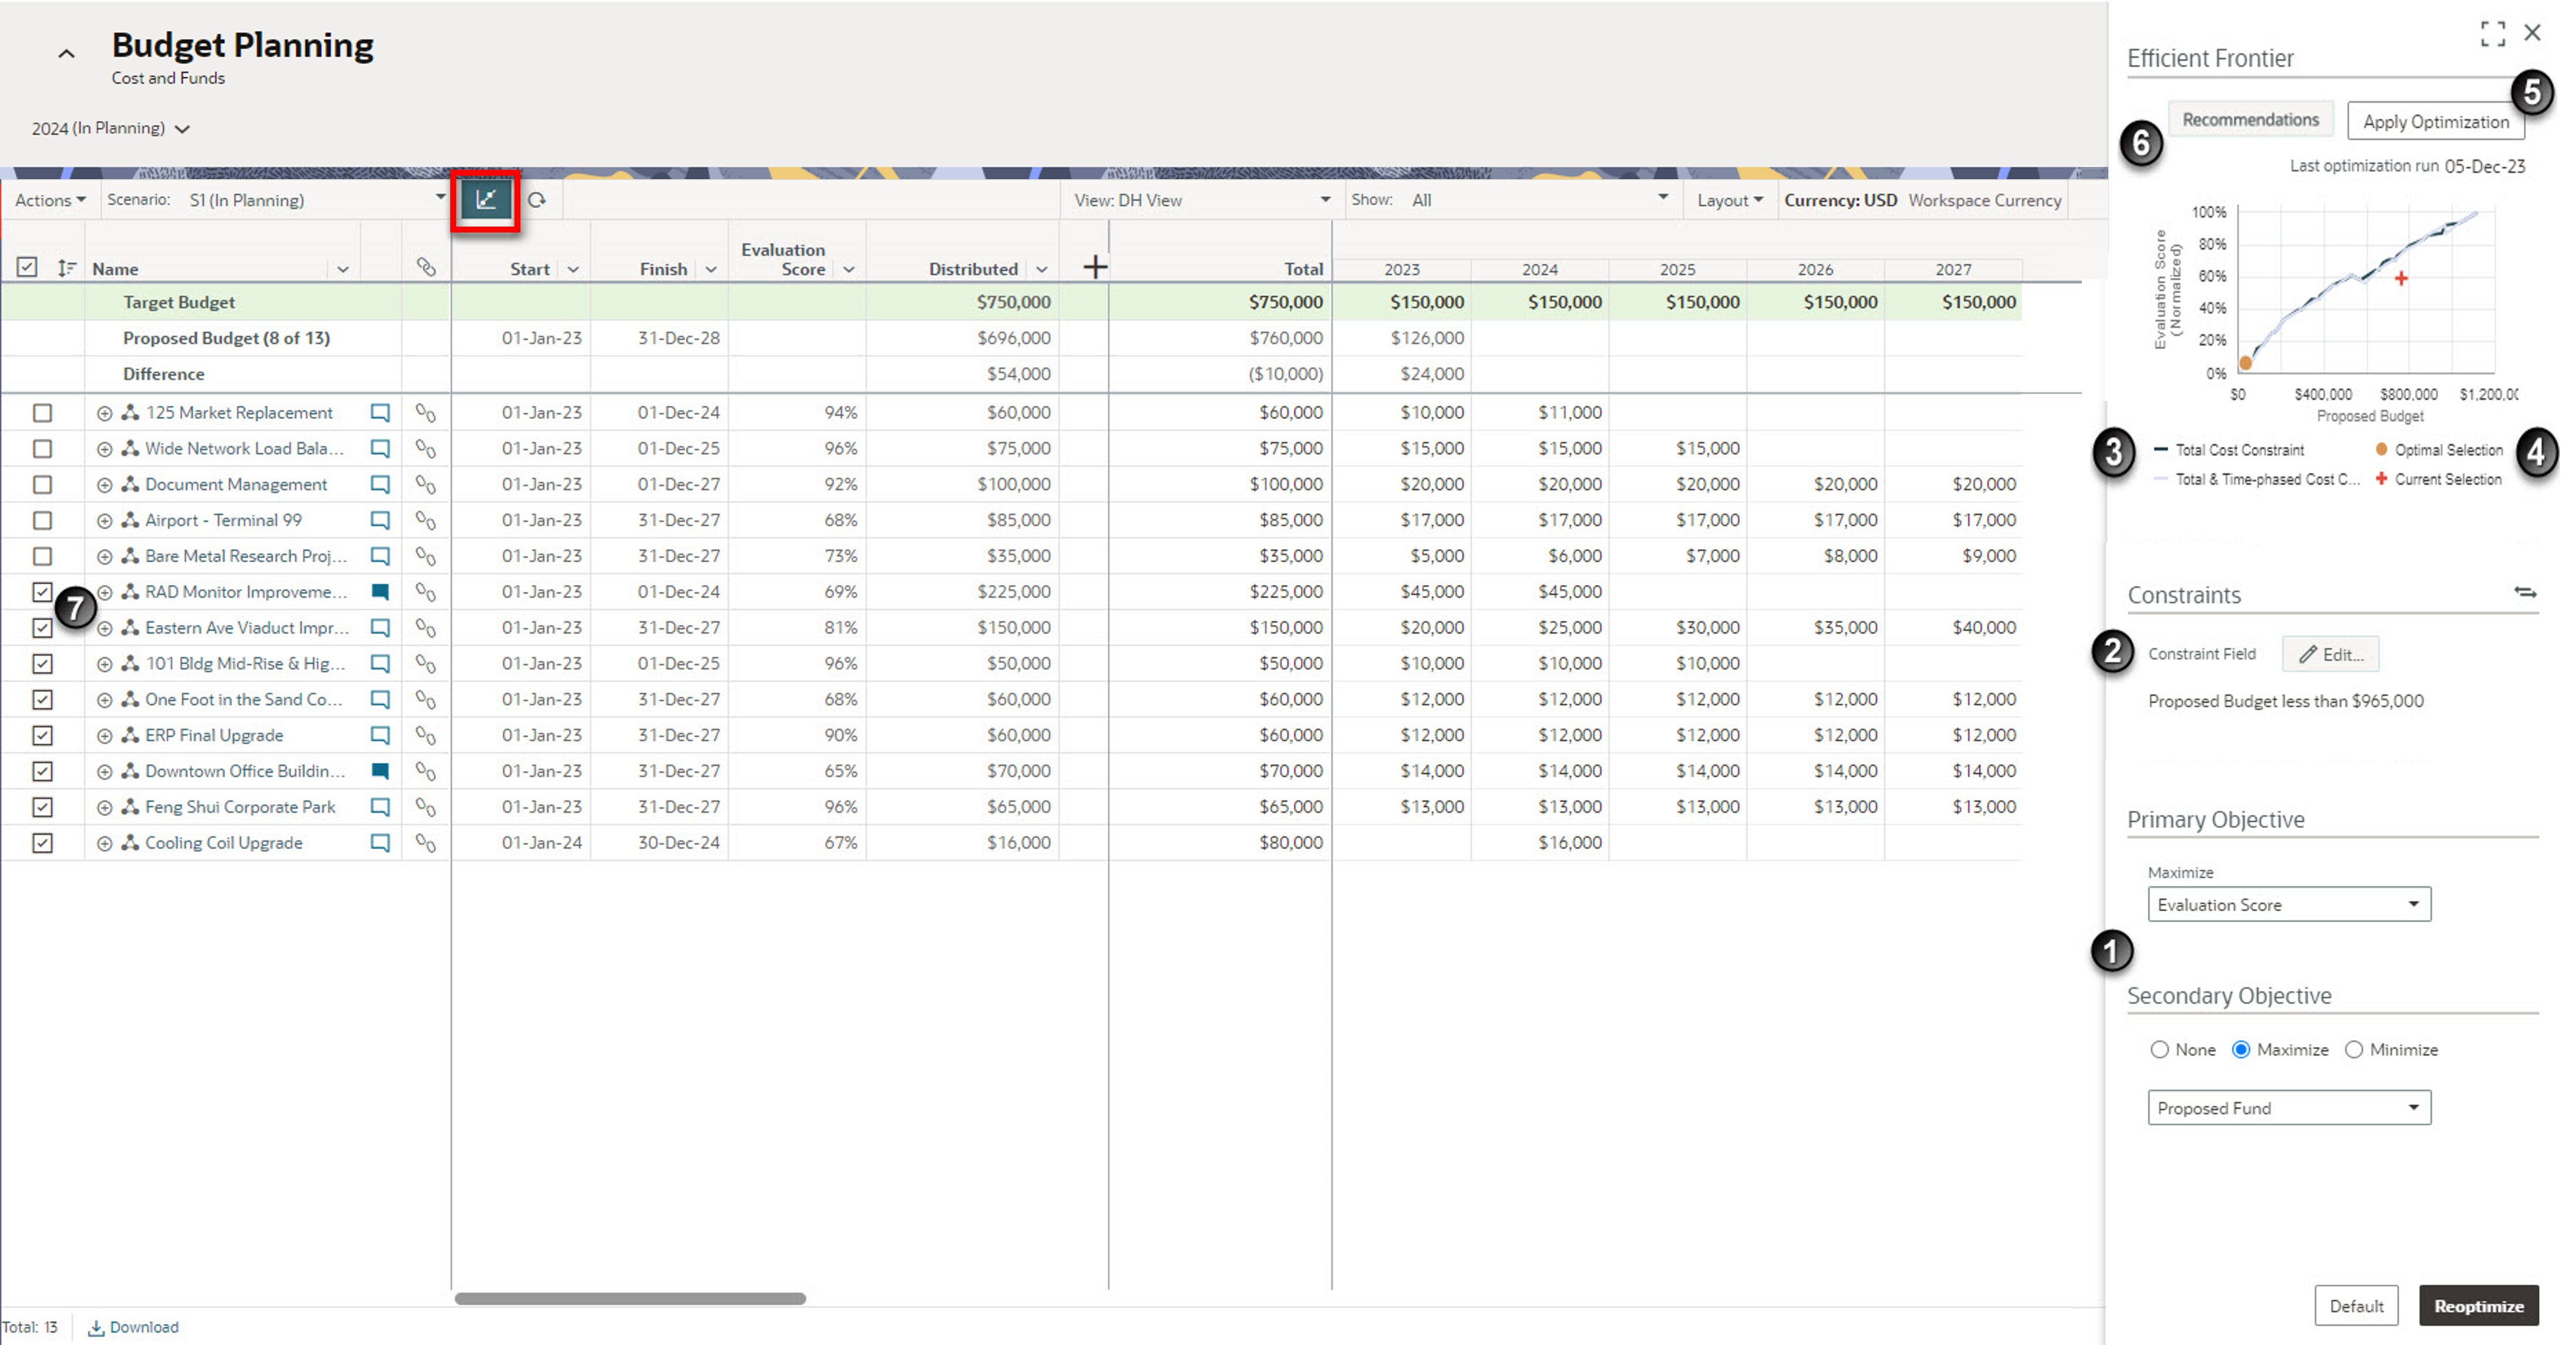
Use the Optimization tool on the Budget Planning page to generate a selection of projects that maximizes the portfolio value under a given set of project and cost constraints. Specify cost constraints and objective values, and then run the optimization to view the optimal selection.

Table of Screen Highlights
Item | Description |
|---|---|
1 | Objectives: Select a Primary Objective field whose value you want to maximize. Optionally, maximize or minimize a Secondary Objective field value to further refine optimization results. |
2 | Constraints: Configure cost constraints manually or, if fund data has been entered, |
3 | Cost Constraint Lines: The Total Cost Constraint line considers the specified total cost constraint only. The Total & Time-phased Cost Constraints line considers the total cost constraint and the specified time-phased cost constraints. Both lines also consider project budget constraints, project dependencies, and any projects with Forced In or Forced Out states. |
4 | Selection Points: The Optimal Selection point represents the total cost value and total objective value of the optimal set of projects selected by the tool. If you manually select any projects, a Current Selection point is plotted to represent the total cost value and total objective value of the manual selection. |
5 | Apply Optimization: Select Apply Optimization to apply the optimized project selection on the scenario. |
6 | Recommendations: Review alternative time-phased cost distribution scenarios that may achieve greater value for your portfolio. |
7 | Selected Projects: After applying optimization, the State field is highlighted green for projects that have been selected, red for projects that have been deselected, and not highlighted for projects whose state did not change. |
Last Published Sunday, December 21, 2025